At Hazelcast we have a policy of supporting a minor version for two years
since the initial release. For Hazelcast Jet 4.5 this period expired at the
end of April, marking an end of Hazelcast Jet as a standalone product.
Since 2021 our Jet engine, a stream processing system that can do
stateful computations over massive amounts of data with consistent
low latency, has been part of Hazelcast Platform 5.x.
We encourage every Hazelcast Jet user still using any of the Jet 4.x
versions to upgrade to Hazelcast 5.x. There are some minor
incompatibilities in how a Hazelcast instance is started, but e.g. the
Pipeline API is fully backward compatible. See the
upgrade documentation
for details.
Today we're releasing Hazelcast Jet 4.5, the second release this year!
We're bringing Jet closer to IMDG, unifying their SQL syntax and
features. Our goal is to have a single SQL dialect that seamlessly uses
the features of both Jet and IMDG.
This version of Jet is built on Hazelcast IMDG 4.2, check
out
what's new there.
Improved SQL Experience
There used to be an important inconvenience when using IMap from outside
Java — in order to populate it, you first had to create a Java
class for its value, or at best a portable ClassDefinition, which is
declarative but a part of server configuration. In either case you had
to restart the Hazelcast cluster before you could use the new record
type.
This is no longer needed: you can now use CREATE MAPPING and Jet SQL
will automatically translate it to the equivalent ClassDefinition.
This move finally closes the loop and makes the Hazelcast SQL experience
entirely independent of Java. See
Portable Serialization
for more information.
Full Release Notes
Hazelcast Jet 4.5 is based on IMDG version 4.2. Check out its Release
Notes here and,
for the Enterprise Edition,
here.
Members of the open source community that appear in these release notes:
@hhromic
Thank you for your valuable contributions!
New Features
[sql] Dynamic ClassDefinition removes the need to restart the
cluster in order to use a new record type in IMap (#2895)
Enhancements
[jdbc] @hhromic made the batch size limit configurable in the JDBC
sink processor (#2888)
[sql] Optimized the memory footprint of SQL aggregations (#2877)
[sql] Now you can use expressions in SQL generator functions (#2944)
[core] Pulling the data from an IMap/ICache could cause OOME due to
creating too many partition iterators at the same time (#3009)
[core] Removed misleading logging of errors that occur due to
the job being cancelled (#2974)
[pipeline-api] Significantly improved the performance of the pickAny
aggregate operation in sliding windows (it lacked the deduct
primitive) (#2917)
Fixes
[core] Jet's integration with the Java Logging Framework caused it to
inadvertently close System.out from a shutdown hook. This would
then break other shutdown hooks. (#2649)
[core] @hhromic fixed DAG.toDotString() to show the correct queue
sizes (#2887)
[sql] The CREATE MAPPING syntax had a fluke where you could use both
OR REPLACE and IF NOT EXISTS in the same statement (#2921)
[cdc] Implement processed offset feedback in CDC sources (#2854)
[extensions] Updated AWS SDK version to 1.11.976. (#2989)
[extensions] Updated Guava version to 30.1. (#2990)
[extensions] Updated Parquet version to 1.12.0 (#3012)
[extensions] Updated Avro to 1.10.2 (#2950)
[extensions] Updated Jetty version to 9.4.38.v20210224 (#2993)
[extensions] Updated wildfly-openssl to 1 (#2993)
[extensions] Updated ElasticSearch-6 to 6.8.14 (#2993)
[extensions] Updated ElasticSearch-7 to 7.10.0 (#2993)
[extensions] Updated Kafka version to 2.2.2 (#2993)
[extensions] Updated MySql Connector to 8.0.20 (#2993)
[extensions] Updated Apache Http Client to 4.5.13 (#2993)
[extensions] Updated Netty to 4.1.61.Final (#3023)
[extensions] Updated Snakeyaml version to 1.26 [SEC-71] (#3024)
Breaking Changes
The DAG.toDotString(int defaultParallelism) method signature is now
DAG.toDotString(int defaultLocalParallelism, int defaultQueueSize).
Callers must now supply the queue size that will be shown if not
overriden on the edge.
If you enjoyed reading this post, check out Jet at
GitHub and give us a
star!
We're preparing a scientific paper on Hazelcast Jet, describing its
architecture based on symmetric, data-local, non-blocking distributed
event processing. As a part of this effort, we implemented the
vendor-neutral NEXMark
benchmark suite, consisting of 8 streaming queries that aim to capture
typical kinds of questions you're likely to ask about your real-time
data.
The queries deal with a domain model of auctions, sellers, and bids. For
example, Query 5 asks: "Which auctions have achieved the highest price
in the last period?"
In contrast to our previous benchmarks, which focused on single-node
performance (especially GC-induced latency spikes), this time we focus
on horizontal scalability: how do Jet's latency and throughput behave as
you add more and more nodes?
In a cluster of 45 nodes and 720 vCPUs, Jet reached 1 billion
events per second at a 99% latency of 26 milliseconds.
Our Setup
We used the same configuration as in our earlier benchmarks:
Oracle OpenJDK 15.0.1 with a single GC parameter:
-XX:MaxGCPauseMillis
Hazelcast 4.3
Jet's thread pool size: 12 or 14
In our previous experience, we
found you don't need any low-level GC tuning parameters to get great
latency results on the JVM, but you do have to use a recent JDK. We let
the JVM use its default G1 collector and configured it with our desired
GC pause target. Also, note that we size Jet's thread pool a bit below
the system capacity: up to 14 threads on 16-vCPU machines. This
important trick allows the GC to work in the background without
interfering with Jet's real-time computations.
As for the measuring methodology, it is the same as before. Events come
from a generator that lives inside the same JVM as Jet. Every event has
a predetermined moment of occurrence, and it is the generator's duty to
emit it as soon as possible once that time has arrived. Any latency in
emitting the event counts towards the reported latency.
On the output side, we stop the latency clock as soon we observe some
data item corresponding to the newest result. We compare the system time
at that point with the moment at which the query result would ideally
become known. For example, if the query involves a time window, then
the moment at which the window "closes", is that ideal moment.
We don't require Jet to send the results to any outside system, because
we want our results to focus on Jet's performance alone. The code we
used in the benchmark is available on
GitHub.
Benchmark 1: 99.99th Percentile Latency with 20 ms Time Resolution
For the first benchmark we asked this question: using a time resolution
of 50 result updates per second and an input rate of 1 million events
per second, what is the 99.99% latency at different cluster sizes?
The main point of this benchmark is probing deep into the rare system
events that may cause latency spikes, however the original definitions
of NEXMark queries ask for a very low update frequency (once per
minute). At this rate it would take 100 minutes to get barely enough
data to report the 99th percentile latency, and a whole week to get the
99.99th percentile. Therefore we changed this to 50 times per second
(20-millisecond update period).
Having to report another complete set of results (10,000 data points)
every 20 milliseconds, Jet doesn't have time to recover from any hiccup
greater than a few milliseconds. For this reason we configured the GC
pause target to 5 milliseconds (-XX:MaxGCPauseMillis=5).
NEXMark doesn't define the number of distinct keys involved in the
queries, we set it to 10,000 for this benchmark.
We used the setting of 12 Jet threads per node, mostly because that's
what we used in the previous benchmarks. We got these results:
The overall worst case was Query 5 in the largest cluster (20 nodes),
and it came out as 16 milliseconds.
Benchmark 2: 99th Percentile Latency at a Billion Events per Second
Our second question was this: How much hardware would Jet need to reach
a throughput of a billion events per second, while maintaining its
millisecond-level latency?
To test this, we selected the NEXMark query that seemed the toughest on
Jet given the results from Benchmark 1. This is Query 5, which showed
a 99.99% latency 16 milliseconds in a 20-node cluster.
Since this time we'll create much more pressure on the input side,
aiming for the highest possible throughput, we relaxed the timings a
bit. We ask for two updates per second (a new result set every 500
milliseconds), and accordingly had to adjust our percentile to 99% in
order to make it practical. We also relaxed the GC timing, setting
-XX:MaxGCPauseMillis=50.
We started with just a single node, finding the maximum event rate Jet
can keep up with. The definition of "keeping up" is that the latency
stays bounded during the test and doesn't constantly increase. We
repeated the process at increasing cluster sizes, until reaching our
goal of one billion. Here is what we found:
First of all, Jet was able to handle 25 million events per second on a
single node and, even more impressively, this number kept scaling
linearly all the way to our target, which it reached at a size of 40
nodes.
During the process we realized we could let Jet use more threads without
impacting the latency, and since we wanted to minimize the number of EC2
instances, we let it use 14 threads. This still leaves 2 vCPUs to the
background GC work and other system needs. If you look carefully, you
can see the curve in the chart bending slightly upwards at the 20-node
mark, this is an artifact of the 40-node measurements being taken with
Jet using 8.6% more threads per node (14 vs. 12).
The criterion for maximum throughput is just keeping up with the input,
allowing the latency to temporarily reach higher values as long as it
settles back down. In order to gauge Jet's stable latency at various
scales, we did another round of tests at 80% of the maximum throughput
determined for each cluster size. This gave us the following latency
chart:
We can see that, although it's increasing, the latency stays pretty flat
across a range of sizes well exceeding the capacity you'd probably need
from Jet in real life.
Finally, we started from the setup that supported a billion events per
second (40 nodes) and continued adding nodes until we got a stable low
latency. This was our result: 45 nodes, 26 milliseconds.
If you enjoyed reading this post, check out Jet at
GitHub and give us a
star!
Today we're releasing Hazelcast Jet 4.4 and we have some exciting new
features!
Jet SQL
Hazelcast Jet 4.4 brings you the first beta version of our SQL
interface. You can now log into Jet from the command line and issue
queries against the data sources you specify. They can be both data at
rest (batch sources) and live feeds (streaming sources).
If you have Docker at hand, here's something you can try out right now!
(For examples that don't require Docker, go to the
docs.)
For more examples with CSV files, Kafka and IMap, go to the
docs.
We're currently very focused on bringing more features to our SQL, so
stay tuned!
File Connector
The Unified File Connector API gives you a
simple way to read files, unified across different storage systems.
Using the same API you can read files from the local filesystem, Hadoop
FS, Amazon S3, Google Cloud Storage, and Azure Blob Storage. At the same
time, the connector supports a variety of encoding formats: text files,
CSV, JSON, Avro, etc., equally for all storage systems.
Amazon Kinesis Data
Streams (KDS) is a
durable, scalable real-time data streaming service native to the AWS
environment, and fully managed by it. You can use it as both a source
and a sink in a Hazelcast Jet pipeline:
StreamSource<Map.Entry<String,byte[]>> source =KinesisSources.kinesis("Tweets").withInitialShardIteratorRule(".*","LATEST",null).build();Sink<Entry<String,byte[]>> sink =KinesisSinks.kinesis("Tweets").build();Pipeline p =Pipeline.create();
p.readFrom(source).withoutTimestamps().map(e ->entry(e.getKey(),(newString(e.getValue())+"-processed").getBytes(UTF_8))).writeTo(sink);
Hazelcast Jet's primary focus is to leverage all opportunities to
improve the throughput and latency of its computation. One example is
using logic that isn't sensitive to the exact event order. Jet can use
this freedom to optimally load-balance the data across parallel tasks.
This works great for stateless transforms like map and filter as
well as aggregate operations specifically written in terms of
commutative and associative functions. However, Jet also supports
transforms such as mapStateful, where reordering any two events is
likely to result in different output.
In version 4.4 we provide a new option,
pipeline.setPreserveOrder(true), which tells Jet to disable the
dataflow optimizations that result in reordered events. One consequence
of enabling it is that the level of parallelism in the source stage
determines the parallelism of all the subsequent stages because the data
flows in parallel lanes through the pipeline. So if you have a source
that isn't paralellized, your whole pipeline won't be parallelized
either (at least until a stage that explicitly changes the order, such
as rebalance or groupingKey). This feature works best when you have
a partitioned source and you only require strict order among events with
the same key. Then you get both the ordering you need and decent
parallelization.
Improved Packaging
We used to offer Jet packaged with some hand-picked extensions while you
could add others by downloading them separately. As of 4.4 we offer two
kinds: a full package with all the extensions, and a slim one with none.
Normally you want to use the full package, but if you want to optimize
the download size or disk usage, use the slim package.
Along the same lines, we now provide a slim Docker image,
hazelcast/hazelcast-jet:4.4-slim, to serve as the base image in your
Dockerfile that combines it with the extensions, like this:
FROM hazelcast-jet:4.4-slim
ARG JET_HOME=/opt/hazelcast-jet
ARG REPO_URL=https://repo1.maven.org/maven2/com/hazelcast/jet
ADD$REPO_URL/hazelcast-jet-kafka/4.4/hazelcast-jet-kafka-4.4-jar-with-dependencies.jar $JET_HOME/lib/# ... more ADD statements ...
See the
instructions
in our docs for more details.
Full Release Notes
Hazelcast Jet 4.4 is based on IMDG version 4.1.1. Check out its Release
Notes here and,
for the Enterprise Edition,
here.
Members of the open source community that appear in these release notes:
@TomaszGaweda
@hhromic
Thank you for your valuable contributions!
New Features
[sql] SQL Beta: submit jobs to Jet from the command-line SQL shell.
(#2595, #2636, #2648, #2654, #2665, #2729, #2763, #2788)
[file-api] [017] Unified API to create sources and sinks from
file-like resources: local filesystem, Amazon S3, Azure Blob Storage
and Data Lake Storage, Google Cloud Storage (#2518)
[kinesis] [018] Amazon Kinesis connector (#2656)
[pipeline-api] [016] Prevent event reordering: by default Jet reorders
data for performance, now you can disable this to get strict event
order where you need it.
Enhancements
[connectors] @hhromic improved the naming of source and sink stages
across different connectors, bringing them all in line with the same
convention xSource / xSink (#2685)
[pipeline-api] @TomaszGaweda added the pipeline.isEmpty() method
that tells whether it contains any stage (#2659)
[core] @TomaszGaweda added the
jet.imdg.version.mismatch.check.disabled config property that
disables the enforcement of the exact IMDG dependency version. This
allows adding IMDG quick fixes to the existing Jet release. (#2610)
[core] New packaging: download either the full package with all the
extensions enabled, or the minimal package and separately download the
extensions you want. (#2796)
[cli] Improved the behavior of jet submit: now it waits for the job
to start and prints a message about it. (#2699)
[python] Improved the error message when using a Python function but
Python is not installed. (#2672)
[kafka] Improved the performance of the Kafka source by fine-tuning
some timeouts. (#2732)
Fixes
[core] Fixed a problem where Jet would close System.out during JVM
shutdown, preventing shutdown hooks from printing to stdout. (#2649)
[file-connector] Fixed the blocking File connector declaring its
processors as cooperative, resulting in performance loss. (#2628)
[file-connector] Several bug fixes in the File connector. (#2772)
[core] Fixed a leak caused by Jet's ephemeral loggers created for each
job. They didn't get released from internal maps in the logging
framework. (#2737)
[core] Fixed two problems with the peek transform. (#2740, #2765)
[hadoop] Fixed a problem when using Hadoop for local files, it behaved
as if the files were shared. (#2764)
Breaking Changes
None.
If you enjoyed reading this post, check out Jet at
GitHub and give us a
star!
We took part in Google Summer of Code that ended just a few weeks ago,
and this release already brings a productionized piece of work by our
student, Mohamed Mandouh:
distributed in-memory sorting. Mohamed's primary focus was research into
the feasibility of integrating RocksDB or a similar DB library as a
disk-based state backend for Jet's hash join, aggregation and sorting,
and we plan to continue with this work for some more time.
Here are the main improvements in this release:
Benchmarking and Tuning for Low Latency
Continuing the story from the previous release, we benchmarked and
fine-tuned Jet with a focus on
low-latency processing. Jet can now give you a 99.99th percentile
latency of less than 10 milliseconds at a pipeline throughput of 60M
items/second! Based on this work we significantly expanded the
Operations Guide section on Garbage
Collection with many new
latency-squashing tricks.
BatchStage.sort()
As mentioned, this is the work coming out of this year's GSoC. You can
now sort the data coming out of a batch pipeline stage. For example,
this starts from an asceding sequence 0..9,999, sorts it in descending
order, and prints the result:
var pipeline =Pipeline.create();var integerSequence =TestSources.items(IntStream.range(0,10_000).boxed().toArray(Integer[]::new));
pipeline.readFrom(integerSequence).sort(ComparatorEx.comparing(i ->-i)).writeTo(Sinks.logger());try{Jet.bootstrappedInstance().newJob(pipeline).join();}finally{Jet.shutdownAll();}
Jet's current execution model allows reordering, e.g., when maximizing
parallel throughput in stateless transform stages, which means you may
easily lose the sort order. In the next release we'll add the ability to
set limits on these optimizations so that the ordering survives.
TestSources.longStream()
Our community contributor Guenter
Hesse took the ad-hoc work we did for
our low latency GC benchmarks and productionized it to be included in
our library. If you want to benchmark Hazelcast Jet in a way that
doesn't depend on the specifics of an actual data source, you can use
this distributed event generator that produces a timestamped sequence of
Long numbers. You can then transform the sequence numbers to whichever
mock events you are using for the benchmark:
This stage will generate a steady stream of a million events per second,
keeping the latency of emiting any given event at a minimum. If you run
it in a cluster, every cluster node will generate its share of the
events.
Preserve Job State on Exception
Jet's default behavior (and so far the only choice) is to cancel and
dispose of a job that throws an exception from any part of the pipeline.
This is usually user code, but it could also be IO errors while
contacting outside services. We are now introducing an option that
applies to jobs with enabled fault tolerance: Jet can now keep the job
in a suspended state, with the latest snapshot attached to it. Once you
remove the cause of the exception, you can resume the job and it will
continue executing without data loss.
As a part of these improvements, we added a whole new section on error
handling in the Programming Guide.
Make Continuous Progress in Pipelines Based on Ingestion Time
Hazelcast Jet is primarily built to respect the original event
timestamps instead of just noting the time it received them. Time
advances in the pipeline when events with fresh timestamps arrive. This
system has an Achilles' heel for the case where the event stream is very
sparse: without events, time doesn't pass. When you have a partitioned
data source, each partition has its own event time, and Jet must
consolidate them into a single global event time. For this to work out
without losses, time advances according to the "slowest" partition, with
the lowest local event time. So all it takes is a single partition out
of potential hundreds or thousands, to experience very low traffic, and
your entire pipeline experiences stalls.
In this release we bring a partial solution to this general problem:
if you happen to work with a pipeline based on ingestion time instead of
event time, Jet can be certain that the time advances in any partition
with or without events. We use this to improve our watermark emission
logic and make progress regardless of actual events coming in. We expect
to invest more effort into heuristic approaches that will improve the
progress of event time-based pipelines as well.
Full Release Notes
Hazelcast Jet 4.3 is based on IMDG version 4.0.3. Check out its Release
Notes here and,
for the Enterprise Edition,
here.
Members of the open source community that appear in these release notes:
In this post, we will take a legacy application and improve its search
functionality. We will do this with only a few changes to the
application itself. Using a technique called change data capture (CDC)
we will listen for changes in a database and react to these
changes - write to a search index case. Before writing to the
search index, we will also enrich the data with a natural language
processing (NLP) step that extracts keywords from a text description.
We might want to use an external search index for various reasons,
especially:
to provide more feature-rich functionality than full-text search in a
relational database;
to scale the search independently of the database;
to add more functionality (keyword extraction) to the application
without
modifying it - making changes to a legacy application is sometimes
risky, or time-consuming, so taking this approach might be faster,
therefore cheaper.
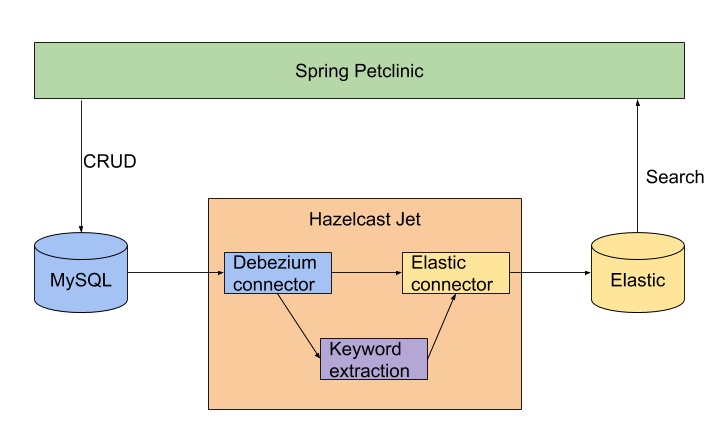
In this tutorial we will do the following:
Use Hazelcast Jet - an open-source stream processing system - and its CDC
module to read changes made to the application database for further
processing in a Jet pipeline.
In the Jet pipeline, we will enrich the data with an NLP mapping step.
Write the results to an Elasticsearch index, using an Elasticsearch
connector, released in Jet 4.2.
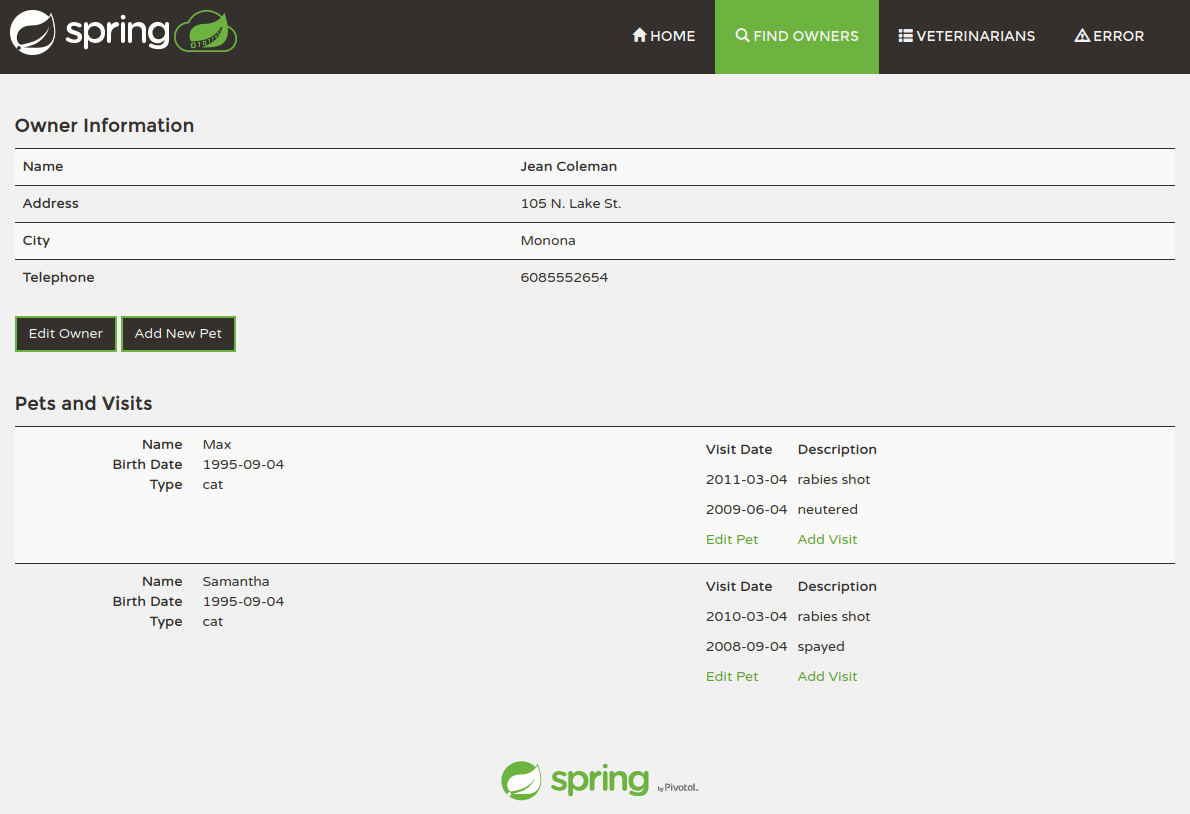
The Application
We chose the Spring
PetClinic
application. It is relatively well-known to many Java developers and is
rather similar to a typical enterprise application.
The application provides a management tool for managing pets, their
owners, and visits to vets. It allows searching for owners, but only
using the owner’s last name. We will make the search more feature-rich,
allowing us to search on first name, last name, pet names and keywords
extracted from descriptions of the visits.
First, let’s start a vanilla version of the application. Run the
following command to start MySQL database inside a Docker container, we
use the official MySQL image, which allows us to create a database for
the pet clinic application easily:
Clone the pet clinic application source code from
Github (this is a
fork of the official Spring PetClinic
repository with a
branch containing the changes we will make later for your convenience).
Start the pet clinic application from the command line by running the
following command:
cd spring-petclinic
./mvnw spring-boot:run -Dspring-boot.run.profiles=mysql
And wait for the following log message:
2020-09-30 16:17:04.113 INFO 24847 --- [ restartedMain] o.s.s.petclinic.PetClinicApplication : Started PetClinicApplication in 3.177 seconds (JVM running for 3.5)
and you should see a screen similar to the following:
Prepare for Change Data Capture
In order to stream the changes from the MySQL database we need to modify
certain settings and grant more permissions to the petclinic user.
Run the following command to start MySQL client, enter the mysql
password for the root user:
docker run -it --rm --link petclinic-mysql:petclinic-mysql mysql mysql -hpetclinic-mysql -uroot -p
Run the following to grant privileges to the petclinic user to allow
listening to the database changes:
ALTERUSER petclinic IDENTIFIEDWITH mysql_native_password BY'petclinic';
GRANT RELOAD ON *.* TO'petclinic';
GRANTREPLICATIONCLIENTON *.* TO'petclinic';
GRANTREPLICATIONSLAVEON *.* TO'petclinic';
The ALTER USER command changes the default authentication method to
one supported by the Jet CDC connector. The GRANT commands allow the
petclinic user to stream changes from the database in the same way as
during master-slave replication.
Start Elasticsearch
We want to enable full-text search across multiple fields, but not all
fields. With Elasticseach we need to create an index mapping that
copies fields into a single field, the field is then used for searching.
Run the following command to start Elasticsearch inside a docker
container:
The default setting of Elasticsearch analyzer is suitable for us. For
more elaborate configuration of the text analysis, you should look into
the Elasticsearch documentation or some other source.
Hazelcast Jet Job
Now that we have the Petclinic and Elastic set-up and working, we can
start the data pump - a Jet job reading change events from MySQL
database and writing into the Elastic index.
A Jet job is a pipeline of steps that read, modify, aggregate or store
data items. The job definition is written in Java and packaged as a jar
file. The jar file is deployed to a Jet cluster, which takes care of the
execution, scaling, fail-over and other operational aspects.
The job consists of 4 main parts:
CDC Source connecting to MySQL database
A mapping step running the keyword extraction
A joining step reconstructing the document from change records from
different tables
Elasticsearch sink
CDC Source
The configuration of the source is straightforward, just set the required
parameters:
Use the source to read change events from MySQL into the pipeline:
Pipeline p =Pipeline.create();StreamStage<ChangeRecord> allRecords = p.readFrom(mysqlSource).withoutTimestamps();
Keyword extraction
The next step in the pipeline is to extract the keywords from the visit
description. We will use Rapid Automatic Keyword Extraction (RAKE)
algorithm, the implementation we use was originally published on
Github. The implementation is not
important for the demonstration, you could use any other Java library,
call a 3rd party service, e.g. via grpc or use our
python integration.
// Create factory for keyword serviceServiceFactory<?,Rake> keywordService =ServiceFactories.sharedService((context)->newRake("en"));
p.readFrom(mysqlSource).withoutTimestamps().mapUsingService(keywordService,PetClinicIndexJob::enrichWithKeywords)
The method enrichWithKeywords simply passes the description field from
the change record to the keyword extraction service and sets the results
into the keywords field of the Visit instance.
It is a common pattern to enrich an item in a pipeline with more
information. Hazelcast Jet works with POJOs in the pipeline, so you
need to somehow compose the original item and the enriching information.
One option is to use tuples. This works for a small number of fields.
Another option would be to use a domain-specific object holding all the
information - e.g. the keywords field. If you are on Java 14 or
newer, you might want to give the Records preview
feature a try.
Joining
Change data capture sends changes to the database as individual records
(represented by
ChangeRecord).
Each record represents a changed row in a database table. If a single
row is all that you need, you are good to go. You can see such example
in our Evergreen Cache blog
post. But having a
single row to work with is not always the case - often you need to
aggregate either multiple records from the same table or join records
from different tables into a single aggregate record.
In our case, we need to join 3 tables into a single document, which we
then index into Elasticsearch. To perform the joining we will use
mapStateful step. This can be performed either globally or partitioned
on a grouping key. If all your records share a common key it is always a
good idea to do the grouping by the key, because the mapping state is
then evenly distributed across all nodes and the mapping operation
parallelized.
Our visit record contains the pet ID but not the owner ID, in such case,
so we don’t have a single grouping key for all records. There are two
options:
perform the stateful mapping globally, which has the advantage of
having a single state - the joining logic is simpler and the pipeline
more straightforward. The obvious disadvantage is that such a solution
is not scalable because the state may not fit onto a single member and
must be performed by a single thread;
create two separate mapping steps - one grouped on the owner ID and
the other on the pet ID. This is a trade-off between simplicity and
scalability.
There are several observations which hold for both implementations:
the mapping state must cover all data from the beginning, unless there
is a domain-specific rule that would allow eviction of old items;
the records might arrive in any order, even if there is a foreign key
between the records in the database, the order is not guaranteed, this
is a property of CDC.
once the object is emitted from the join step, it must not be
modified, otherwise the later stages might see it in inconsistent
state, causing issues which are hard to debug. We make defensive copies
to avoid this.
The ChangeRecord#operation() method provides information about what
kind of operation was performed on the record. If you need to handle
deletions, you should use it. The Petclinic application doesn’t allow
delete operations, so we don’t handle those.
Elastic sink
The fourth key part of the pipeline is the Elastic sink. It takes a
document and writes it to Elasticsearch. You as the developer need to
provide information where the Elastic instance is running, what index to
write to and how to convert the Document into one of IndexRequest,
UpdateRequest or DeleteRequest. The Sink then takes care of batching
the requests and parallelizing for higher performance, retries in case
of network issues.
The Pipeline
The final pipeline composes all the individual steps in a
straightforward way:
Pipeline p =Pipeline.create();
p.readFrom(mysqlSource).withoutTimestamps().map(PetClinicIndexJob::mapChangeRecordToPOJO).setName("mapChangeRecordToPOJO").mapUsingService(keywordService,PetClinicIndexJob::enrichWithKeywords).setName("enrichWithKeywords").mapStateful(JoiningState::new,JoiningState::join).setName("JoiningState::join").writeTo(elasticSink);
Or visualized as a graph:
For the pipeline with the two-step join see the source
code
on Github. This is the graph visualisation of the pipeline:
Testing the job
In order to test the job, we need to create a test database identical to
the Petclinic database.
We have the following options:
Start the pet clinic application inside the same JVM - the Petclinic
is a Spring Boot application, running it in-process would be
relatively easy, but it represents a legacy application, which is
usually quite difficult to run in such way. Also, there is a high
probability of dependency clashes, which would make this difficult.
Start the pet clinic application in a Docker container - it is likely
that the application is not containerized, we would need to create
such an image only for the tests.
Create the database and data using SQL directly - reusing the SQL
scripts from the Petclinic application and running inserts via JDBC
seems the easiest way to do this so we will continue with this approach.
Now that we have the data in Elasticsearch index, we can update the
Petclinic application to use it for search.
There are several changes in the application, but the most important
changes are:
created a search service to search for the data;
update the search endpoint to use the new search service.
The following snippet shows the search method in the SearchService. It
uses the Elasticsearch client directly, but one could use Spring Data
Elasticsearch as well.
The search endpoint will use the SearchService to search for the data.
After retrieving the results the Owner entities need to be loaded from
the database. This is not an issue as only a small subset of
best-matching documents is returned from Elastic and loaded by ID from
the database.
Collection<Integer> ownerIds = searchService.search(searchForm.getQuery());// find owners by last nameCollection<Owner> results =this.owners.findByIds(ownerIds);
There are some more minor changes to the view and the controller, you
can see all the changes in this
commit.
Checkout the elasticsearch branch with the changes and restart the
application by running the Maven command again:
We can verify that searching for “George” returns 2 results, one found
in the first name, other in the name of a pet:
Entering “rabies” should bring up a single result (the detail screen is
shown in that case) matching a keyword extracted from the description:
Summary
We have shown how to stream changes using CDC, enrich the data,
correlate (join) the records with other records and finally store the
data into an Elasticsearch index, so an application can provide better
search functionality to the user.
This is mostly done independently of the original application and its
database, reducing the impact it has on the original legacy system.
Change Data Capture (CDC) refers to the process of observing
changes made to a database and extracting them in a form usable by
other systems, for the purposes of replication, analysis and many more.
Hazelcast Jet is a distributed, lightweight stream processing
framework. It allows you to write modern Java code that focuses purely
on data transformation while it does all the heavy lifting of getting
the data flowing and computation running across a cluster of nodes. Jet
stores computational state in fault-tolerant, distributed in-memory
storage, allowing
thousands of concurrent users granular and fast access to your data
without breaking a sweat.
While stream processing is a natural solution for providing insight into
many big-data workloads, it’s a relatively new evolution over its
predecessor - offline batch processing. Utilizing stream processing
effectively requires re-architecting existing systems to event-driven
architectures and introducing several new components. This process is
not always straightforward and also requires a shift in mindset.
In this context, the functionality provided by change data capture
technologies, for which Debezium is one of the, if not THE best
open-source alternative, is a godsend. To be able to ingest data from
relational databases, without affecting the applications that use them,
changes the game for streaming systems. It becomes possible to safely
extend old systems with all kinds of new functionality: real-time
analytics, complex event processing, anomaly & fraud detection and so
on.
Integration
When we first considered integrating Debezium into Jet, the most
important decisions were centered around the fact that Debezium is
designed to be deployed via Apache Kafka
Connect, which then
takes care of fault tolerance and scalability. Fortunately, Jet is
fully capable of providing these crucial services. Also, Kafka Connect
is a good enough abstraction that we were able to mimic it for Debezium.
We are aware that Debezium also offers an embedded mode for
applications not interested in fault-tolerance guarantees such as
exactly-once processing and resilience, but since Jet does not have a
“dumbed down” version (even as full-blown is light enough to be
embedded), we quickly discarded this approach.
So, first, we added generic support for Kafka Connect sources to Jet,
which should be a valuable feature even outside the scope of CDC. Then
we used Debezium to build a Kafka Connect source for Jet. Well… “build”
might be overstating it. Debezium already is a Kafka Connect source. We
just had to make sure that Jet’s specific fault-tolerance mechanisms
will interact with it properly, through the Kafka Connect API.
Synergy
One immediate benefit that Jet offers to Debezium users is eliminating
the need for external services. No Zookeeper, no Kafka needed. When
using Debezium through Jet, the latter takes care of the whole lifecycle
and fault tolerance of all the components involved. The setup is greatly
simplified.
Then, obviously, there is the stream processing capability, because
that’s what Jet does. Not only do you get access to the data, but you
also have the toolbox to process it, extract whatever insights you need
from it.
In addition, Jet also aims to offer further convenience wrappers when
the Debezium source is being used. For example:
builders for the most common configuration properties to make setting
up Debezium for some specific DB as simple as possible
standard Java interfaces to give structure to the complex Debezium
events
JSON parsing, including mapping to Objects, based on Jackson
jr, to simplify how parts
of - or even entire Debezium events can be interpreted
For an example look at this sample from our CDC
tutorial. All
the code you would need to build an in-memory replica of your MySQL
database table would be something like:
StreamSource<ChangeRecord> source =MySqlCdcSources.mysql("source").setDatabaseAddress("127.0.0.1").setDatabasePort(3306).setDatabaseUser("debezium").setDatabasePassword("dbz").setClusterName("dbserver1").setDatabaseWhitelist("inventory").setTableWhitelist("inventory.customers").build();Pipeline pipeline =Pipeline.create();
pipeline.readFrom(source).withoutTimestamps().writeTo(CdcSinks.map("customers",
r -> r.key().toMap().get("id"),
r -> r.value().toObject(Customer.class).toString()));JobConfig cfg =newJobConfig().setName("mysql-monitor");Jet.bootstrappedInstance().newJob(pipeline, cfg);
Architecture
I have stated above that when Debezium is integrated into Jet, the
latter takes on the role of service-provider as far as fault tolerance
and scalability are concerned.
Jet doesn't delegate its cluster management and fault tolerance concerns
to an outside system like ZooKeeper. It reuses the groundwork
implemented for Hazelcast IMDG: cluster management and the IMap, and
adds its own implementation of Chandy-Lamport distributed snapshots. If
a cluster member fails, Jet will restart the job on the remaining
members, restore the state of processing from the last snapshot, and
then seamlessly continue from that point. For further details, consult
our documentation on the
topic.
Extending this functionality umbrella to cover Debezium has been
surprisingly simple. All we had to do was to add Debezium’s
source offset to Jet’s snapshots. This way, whenever Jet needs to
execute a recovery, it passes the recovered offset to Debezium,
which in turn resumes the data flow from that offset.
One other thing we did and might be worth mentioning is that the Jet
integration also makes use of Debezium’s new record state
extraction
SMT (Simple Message Transformation), for the purpose of message
structure simplification. With this transformation in effect, only the
"after" structure of the Debezium event envelope is processed by Jet.
However, whether this is a good idea or not, only time will tell. I
personally think that if and when we will start covering schema changes
more, we might end up re-enabling the full Debezium event content.
Examples
The simplest example of using the Jet-Debezium integration would be our
CDC tutorial that I’ve
already mentioned above. A more involved one can be seen in my
colleague’s, Nicolas Fränkel’s blog
post.
License
The Jet - Debezium integration is currently provided under the Apache
License, Version 2,
just like Debezium and most of Jet (full details here),
so making full usage of the combination of the two should have no
impediments in your own projects.
Looking ahead
At the moment of writing the Jet-Debezium integration is fully finished
only for MySQL and Postgres databases and has been released in version
4.2 of Jet.
Further work on covering more connectors and extending current
ones (for example by adding handling for database schema changes),
has not yet been scheduled.
The functionality provided by Debezium, the ability to allow modern
processing of legacy data is a great fit to Jet’s ability to carry out
that processing efficiently. The combination of the two has the
potential to become much more than the sum of their parts. I very much
look forward to finding out what this integration can lead to. Stay
tuned!
In Part 3 we showed that a modern JVM running live stream aggregation
can achieve a 99.99% latency lower than 10 milliseconds. The focus of
that post was comparing the different GC options available for the JVM.
In order to maintain a level playing field, we kept to the default
settings as much possible.
In this round we wanted to look at the same problem from the opposite
angle: what can we do to help Hazelcast Jet achieve the best performance
available on a JVM? How much throughput can we get while staying within
the tight 10 ms bound for 99.99th percentile latency? We found our
opportunity in a distinct design feature of Jet: the Cooperative Thread
Pool.
Native Threads with Concurrent GC
Let's go through an example with a streaming job running on a four-core
machine. In a typical execution engine design, every task (roughly
corresponding to a DAG vertex) gets its own thread
to execute it:
There are eight threads and the OS is in charge of deciding how to
schedule them to run on the four available cores. The application has
no direct control over this and the cost of switching from one thread
to another on the same CPU core is around 2-10 microseconds.
This is how it will look when we add a concurrent GC thread into the
picture:
There's one more thread now, the concurrent GC thread, and it's
additionally interfering with the computation pipeline.
Green Threads with Concurrent GC
In Hazelcast Jet, tasks are designed to be
cooperative: every time you give
it a bunch of data to process, the task will run for a short while and
return. It doesn't have to process all the data in one go and the
execution engine will give it control again later with all the
still-pending data. This basic design is also present in the concepts of
green threads and coroutines. In Hazelcast Jet we call them
tasklets.
This design allows Jet to always use the same, fixed-size thread pool no
matter how many concurrent tasks it instantiates to run a data pipeline.
So, on the example of a four-core machine, it looks like this:
By default, Jet creates as many threads for itself as there are
available CPU cores, and inside each thread there are many tasklets.
Switching from one tasklet to the next is extremely cheap — it
boils down to one tasklet returning from its call() method, the
top-level loop taking the next tasklet from a list, and invoking its
call() method. If you wonder at this point what happens to blocking IO
calls, for example connecting to a JDBC data source, Jet does support a
backdoor where it creates a dedicated thread for such a tasklet. Threads
that block for IO aren't CPU-bound and usually their interference is
quite low, but in a low-latency applications you should avoid depending
on blocking APIs.
Now comes another advantage of this design: if we know there will also
be a concurrent GC thread, we can configure Jet to use one thread less:
There are still as many threads as CPU cores and the OS doesn't have to
do any context switching. We did give up one entire CPU core just for
GC, reducing the CPU capacity available to Jet, but we allowed
background GC to run truly concurrently to the Jet tasks. In low-latency
scenarios, the application doesn't need 100% CPU, but it needs its
share of the CPU 100% of the time.
We went to see if this setup really makes the difference we hope for,
and found it indeed had a drammatic impact on the latency with both
garbage collectors we tested (G1 and ZGC). The most important outcome
was that we were now able to push G1 below the 10 ms line. Since G1 is
stable across a wide range of throughputs, we immediately got it to
perform within 10 ms at double the throughput than in the previous
round.
The Setup
Based on the expectations set by the previous benchmark, we focused on
the ZGC and G1 collectors and the latest pre-release of Java 15. Our
setup stayed the same for the most part; we refreshed the code a bit and
now use the released version 4.2 of Hazelcast Jet with OpenJDK 15 EA33.
We also implemented a parallelized event source simulator. Its higher
throughput capacity allows it to catch up faster after a hiccup, helping
to reduce the latency a bit more. The processing pipeline itself is
identical to the previous round,
here
is the complete source code.
We determined how many threads the given GC uses, set the size of the
Jet thread pool to 16 (=
c5.4xlarge vCPU count)
minus that value and then did some trial-and-error runs to find the
optimum. G1 uses 3 threads, so we gave Jet 13. ZGC uses just 2 threads,
but we found Jet to perform a bit better with 13 instead of the
theoretical 14 threads, so we used that. We also experimented with
changing the GC's automatic choice for the thread count, but didn't find
a setting that would beat the default.
Additionally, with G1 we saw that in certain cases, even with
MaxGCPauseMillis=5 (same as in the previous post), the size of the new
generation would grow large enough for Minor GC pauses to impact
latency. Therefore we added MaxNewSize with one of 100m, 150m and
200m, depending on the chosen throughput. This was also determined
through trial and error, the results seemed to be the best when a minor
GC was occurring about 10-20 times per second.
Summarizing, these are the changes we made with respect to the setup in
the previous post:
Reduced Jet's cooperative thread pool size
Parallel event source where previously it was single-threaded
Used the MaxNewSize JVM parameter for G1
Updated Hazelcast Jet and JDK versions
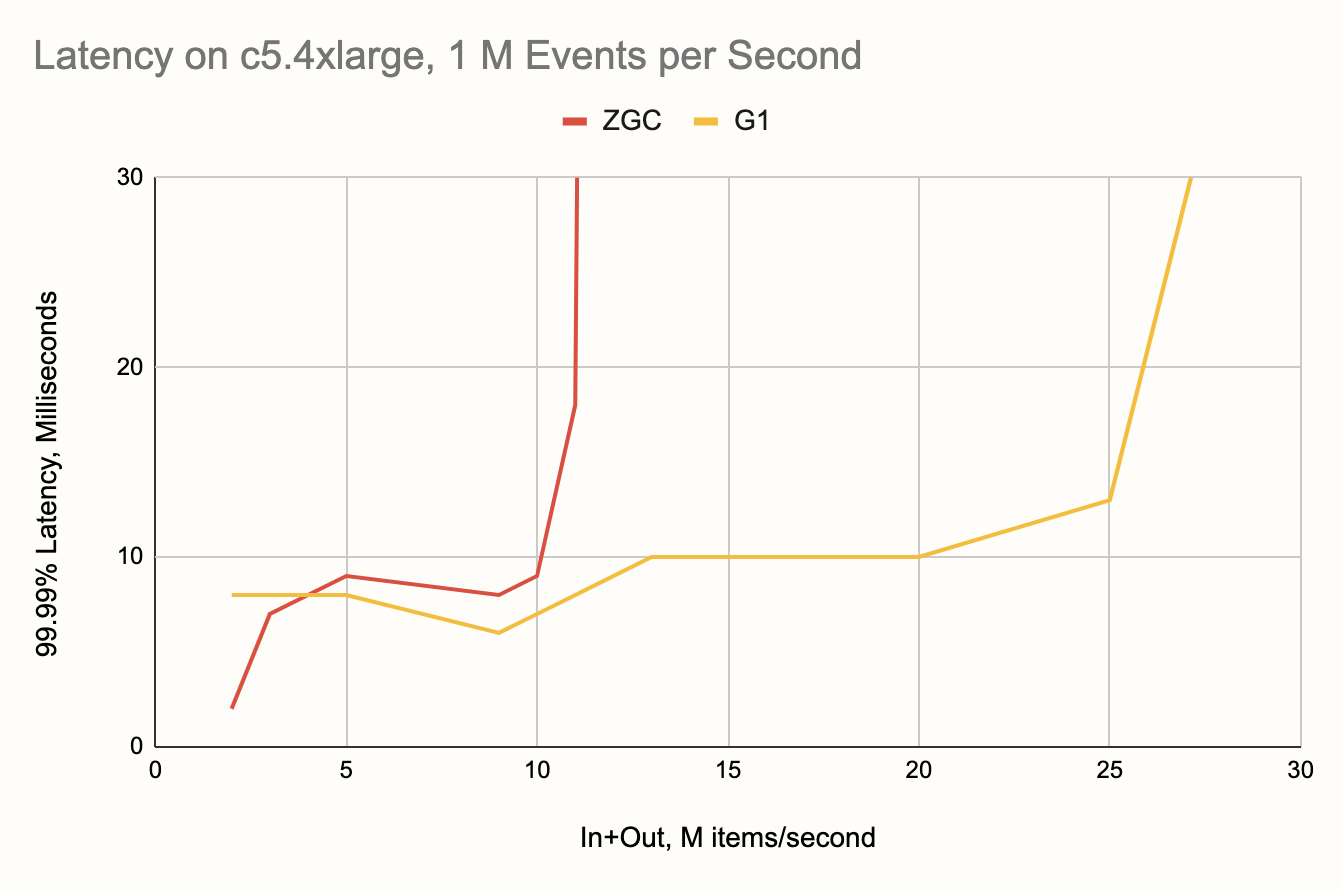
The Results
Comparing ZGC's results below with those in the previous
round,
we can see the latency stayed about the same where it was already good,
but the range of throughputs got extended from 8 to 10 M items/second,
a solid 25% improvement.
The effect on G1 is sort of dual to the above: while the G1 already had
great throughput but fell just short of making it below the 10 ms line,
in this round its latency improved across the board, up to 40% at
places. The best news: the maximum throughput at which a single
Hazelcast Jet node maintains 99.99% latency within 10 ms now lies at 20
million items per second, a 250% boost!
Upgrading to 10 M Input Events per Second
Encouraged by this strong result, we dreamed up a scenario like this: we
have 100,000 sensors, each producing a 100 Hz measurement stream. Can a
single-node Hazelcast Jet handle this load and produce, say, the time
integral of the measured quantity from each sensor over a 1-second
window, at a 10 ms latency? This implies an order-of-magnitude leap in
the event rate, from 1 M to 10 M events per second, but also a reduction
in window length by the same factor, from ten seconds to one.
Nominally, the scenario results in the same combined input+output
throughput as well as about the same size of state that we already saw
work: 20 M items/second and 10 M stored map entries. It's the maximum
point where G1 was still inside 10 ms, but even at 25 M items/second it
still had pretty low latency. However, for reasons we haven't yet
identified, the input rate seems to have a stronger impact on GC, so
when we traded output for input, it turned out that G1 was nowhere near
handling it.
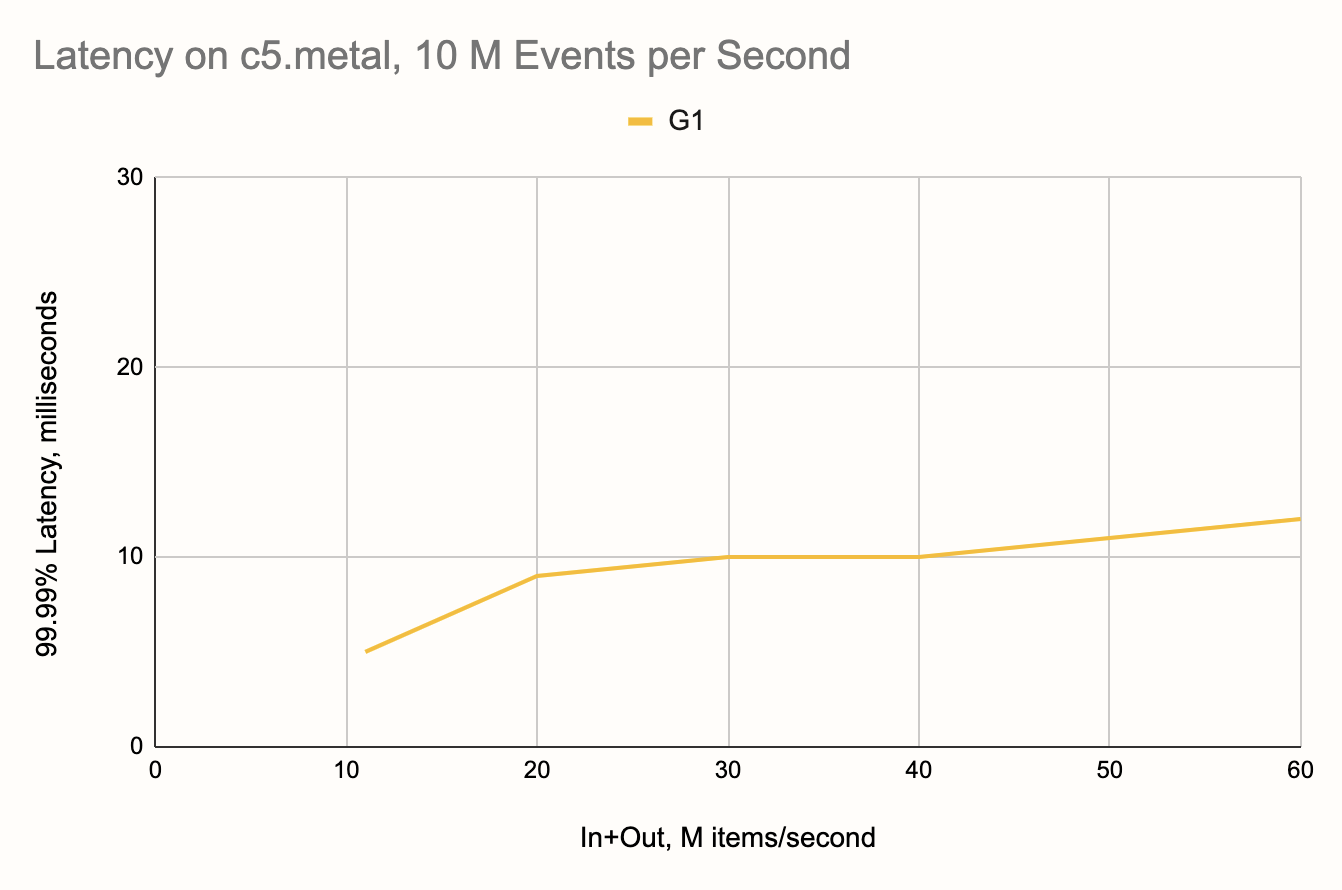
But, since we picked the c5.4xlarge instance type as a medium-level
option, for this "elite scenario" we considered the top-shelf EC2 box as
well: c5.metal. It commands 96 vCPUs and has some scary amount of RAM
that we won't need. On this hardware G1 decides to take 16 threads for
itself, so the natural choice would be 80 threads for Jet. However,
through trial and error we chased down the real optimum, which turned
out to be 64 threads. Here is what we got:
G1 comfortably makes it to the 20 M mark and then goes on all the way to
40 M items per second, gracefully degrading and reaching 60 M with just
12 ms. Beyond this point it was Jet who ran out of steam. The Jet
pipeline running at full speed just couldn't max out the G1! We repeated
the test with more threads given to Jet, 78, but that didn't make a
difference.
If you enjoyed reading this post, check out Jet at
GitHub and give us a
star!
It has been said that there are two things hard in software development:
naming things and cache invalidation (while some add off-by-one errors
to the mix).
I believe that keeping the cache in sync with the source of truth might
count as a third one.
In this post, I'd like to tackle this issue, describe the ideal
situation -
1 cache, 1 datastore - describe the problem of having multiple components
that can write to the datastore, list all possible solutions, and
describe one elegant solution based on Change Data Capture and Jet.
The ideal design
In a system, to improve performance, one of the first short-term
measures is to set up a cache.
It's a tradeoff between getting the data faster at the cost of the data
being not that fresh: one loads the data in-memory close to the
consumer, and presto, one gets an instant performance boost. In regard
to a database, this is akin to the following:
In this read-through design, when the app requires an item, the cache
first checks whether it has it.
If yes, it returns it.
If not, it fetches it from the underlying Relational Database Management
System, stores it, and returns it.
For a write, it stores it, and also calls the RDBMS to store it.
Note that using a cache-aside design instead of read-through would have
the same issue.
The only difference would be the fact that the app would be responsible
for the fetching/storing logic instead of the cache.
The RDBMS is the sole source of truth - as it should be. Since the cache
intercepts write statements to the RDBMS, it's a mirror of the data.
Handling third-party database updates
This design works as expected as long as the database doesn't receive
updates from another source:
Now, the RDBMS is still the source of truth, but the cache is not aware
of changes made by other components.
Hence, it might (will) return data that it has stored, but that is stale
compared to what is the source of truth in the RDBMS.
There are multiple ways to cope with this issue.
Cache invalidation
Since the cache only queries the RDBMS if it doesn't store the requested
item, let's remove items after a specific time.
This is a built-in feature in enterprise-grade caches such as Hazelcast
IMDG and it is known as the Time-To-Live.
When an item is stored, a TTL can be attached to it.
After that time has elapsed, the item is removed from the cache and it
will be fetched from the RDBMS again if needed.
This approach has a couple of downsides:
If an item is not updated in the RDBMS, but is evicted from the
cache, then there's an extra query from the cache to the RDBMS when
it's needed by the app. This is a net loss of resources.
If an item is updated in the RDBMS, but its TTL has not been reached
yet, then the cache will return the stale data. This defeats the
purpose.
With longer TTL, we avoid unnecessary round trips but return more stale
data.
With shorter TTL, we waste resources with lesser chances of stale data.
Polling the RDBMS
Because the TTL doesn't seem to be the right approach, we could devise a
dedicated component that watches the RDBMS by regularly sending queries
to it and updating the cache accordingly.
Unfortunately, this strategy incurs the same issues as cache
invalidation:
the more frequent the queries, the more chances to catch changes, but
the more resources are wasted.
Worse, this also will put extra load on the RDBMS.
RDBMS triggers
A common downside of the above approaches is the way they both poll the
database.
Polling happens with a specific frequency, while writes don't follow any
regular periodicity.
Thus, it's not possible to make the two match.
Instead of polling, it would make much more sense to be event-driven:
if no writes happen, there's no need to update the cache
if a write happens, then the relevant cache item should be updated
accordingly
In RDBMS this event-driven approach is implemented via triggers.
Triggers are dedicated stored procedures that are launched in response
to specific events, such as an INSERT or an UPDATE.
That works pretty well when the acted-upon object is inside the database,
e.g. "when a record of table A is updated, then add a record to table
B".
For our use case where the acted-upon object is the cache which sits
outside the database, it's not as simple.
For example, MySQL allows you to make an external system call from a
trigger.
However, this approach is very implementation-dependent and makes the
overall design of the system much more fragile.
Also, only some RDBMS implement triggers. Even if they do, there's no
standard implementation.
Change Data Capture
Wikipedia defines Change Data Capture (or CDC) as:
[...] a set of software design patterns used to determine and track
the data that has changed so that action can be taken using the
changed data.
CDC is an approach to data integration that is based on the
identification, capture and delivery of the changes made to enterprise
data sources.
In practice, CDC is a tool that allows to transform standard write
queries into events.
It implements it by "turning the database inside-out" (quote from Martin
Kleppmann).
This definition is because a database keeps a record of all changes in
an implementation-dependent append-only log.
Regularly, it uses it to manage its state. Some RDBMS also have other
usage, e.g. MySQL uses the log for replication across nodes.
For example, here's a sample for MySQL binlog:
### UPDATE `test`.`t`
### WHERE
###   @1=1 /* INT meta=0 nullable=0 is_null=0 */
###   @2='apple' /* VARSTRING(20) meta=20 nullable=0 is_null=0 */
###   @3=NULL /* VARSTRING(20) meta=0 nullable=1 is_null=1 */
### SET
###   @1=1 /* INT meta=0 nullable=0 is_null=0 */
###   @2='pear' /* VARSTRING(20) meta=20 nullable=0 is_null=0 */
###   @3='2009:01:01' /* DATE meta=0 nullable=1 is_null=0 */
# at 569
#150112 21:40:14 server id 1  end_log_pos 617 CRC32 0xf134ad89
#Table_map: `test`.`t` mapped to number 251
# at 617
#150112 21:40:14 server id 1  end_log_pos 665 CRC32 0x87047106
#Delete_rows: table id 251 flags: STMT_END_F
A CDC component connects to this immutable log to extract change events.
One can view CDC as the opposite of Event Sourcing:
the latter captures state by aggregating events, while the former
extracts events "from the state".
Debezium
CDC is quite recent and hasn't had time to mature.
As such, there's no universal standard, but specific tools.
In this section, we are going to have a look at
Debezium.
Debezium is an Open Source set of services for CDC provided by Red Hat.
Debezium is an umbrella term covering several components:
Debezium Connectors are specific bridges that read the append-only
proprietary log for each supported database. For example, there’s a
connector for MySQL, one for MongoDB, one for PostgreSQL, etc.
Each connector is also a Kafka Connect Source Connector:
this allows to easily output CDC events to one’s Kafka cluster
Finally, the Debezium Engine is a JAR that allows Debezium to be
embedded in one’s applications. Note that even in that case, Debezium
produces Kafka Connect-specific content, which then needs to be
handled and transformed in one’s application.
While Kafka is a great technology and probably also quite widespread
nowadays, data in Kafka needs to be persisted to disk.
The benefit of persistence is that data survive even in the event of the
cluster going down.
The tradeoff, however, is that the access time of disk-persisted data is
one (or 2) orders of magnitude slower than the access time of in-memory
data, depending on the underlying disk technology.
Hazelcast Jet
Hazelcast Jet is a distributed stream
processing framework built on Hazelcast and combines a cache with
fault-tolerant data processing.
It has sources and sinks to integrate with various file, messaging and
database systems (such as Amazon S3, Kafka, message brokers and
relational databases).
Jet also provides a Debezium module where it can process change events
directly from the database and write them to its distributed key-value
store.
This avoids having to write the intermediate messages to Kafka and then
read again to be written to a separate cache.
Putting it all together
It’s (finally!) time to assemble all the previous bits together.
Here are the components and their responsibilities:
A MySQL database instance is where the data is stored.
It’s accessed in read-only mode by the cache, and in write-only mode
by some external component
A Jet instance reads events from MySQL through the Debezium connector,
transforms them into cache-compatible key-value pairs, and updates
the cache accordingly. Note that while Jet pipelines provide
filtering capabilities, it’s also possible to filter items in the CDC
connector to optimize the load of the pipeline
The app uses the cache, which is always up-to-date with the database,
give or take the time it takes for the above to execute
Note that this architecture assumes one starts from a legacy state with
an existing app that uses caching, where a new component that could
update the database was set up later on.
If one starts from scratch, it’s possible to simplify the above diagram
(and associated code) as Jet embeds its own Hazelcast instance.
In that case instead of Jet being a client of a third-party Hazelcast
instance, Jet is the one to configure and start the instance.
Obviously, it also can then get/put data.
To try the demo, a local Docker daemon must be running.
To create the necessary Docker images, at the root of the project,
run the build:
mvn compile
At the root of the repo, run the compose file.
This will start a MySQL instance, the app, the Jet pipeline job, as
well as Hazelcast Management Center to get additional insight into
the cluster state
This will open an interactive shell to execute specific commands.
The update command requires two arguments, the primary key of the
Person entity to update, and the new value for the firstName column.
The following command will update the firstName value of the
entity with PK 1 with value "Foo"
update 1 Foo
Refresh the browser again. The cache has been updated, the
application doesn’t access the database, and still the value Foo
should be shown for entity with PK 1
Conclusion
Caching is easy if the cache is the only component that writes to the
database.
As soon as other components update the database, no traditional strategy
to keep the data of the database and the cache in sync is satisfying.
The Hazelcast Jet streaming engine, using Debezium under the hood, is
able to leverage Change Data Capture over traditional RDBMS to achieve
an evergreen cache in a simple way.
Jet 4.2 is finally here! Here's an overview of what's new:
Change Data Capture Support for MySQL and PostgreSQL
Previously, Jet has had support for Debezium as
a contrib package. We're happy to announce that we've made several
improvements to this package and decided to make this a part of our main
release.
Debezium was developed initially as a Kafka Connect module, which can
read the snapshot and changes of relational databases such as MySQL and
PostgreSQL. Jet's Debezium integration removes the Kafka dependency
completely, and you can work with the stream of changes directly using
the full power of the Jet API.
Along with this change, we've created a new high-level API which makes
it easier to work directly with change stream records. For example, to
observe changes from MySQL, all you need to do do is:
You can also combine this feature with Jet's
in-memory-storage allowing you to build an
in-memory replica of the database in just a few lines of code. The
example below will hydrate the distributed map customers with the
records from the database table with the same name:
StreamSource<ChangeRecord> source =MySqlCdcSources.mysql("source")....setTableWhitelist("inventory.customers").build();
pipeline.readFrom(source).withoutTimestamps().peek().writeTo(CdcSinks.map("customers",
r -> r.key().toMap().get("id"),
r -> r.value().toObject(Customer.class).toString()));
For a more in-depth example of this feature, see the CDC
Tutorials.
ElasticSearch Connectors
We've also had ElasticSearch (5, 6, 7) connectors available as contrib
modules and happy to announce that they have also been through several
rounds of improvements and merged into the main release. A summary is
below:
Support for slicing reads: Jet can use the slicing feature of
ElasticSearch to read data in parallel.
Collocated read and write: You can make use of collocated reading from
ElasticSearch by placing Jet on the same nodes as your ElasticSearch
cluster - this will significantly improve the speed of querying and
ingestion.
Improved the retry mechanism for writes: As Jet can be used to write
to ElasticSearch as part of a streaming job, we've improved the retry
mechanism so that transient ES cluster failures can be retries.
The ElasticSearch source and sink can be used with a simple API with the
example given below:
Hazelcast Jet, by default, prefers not to send the data around the
computing cluster. If your data source retrieves some part of the data
stream on member A and you apply a mapping to it, the processing will
only happen on member A. If you have a non-distributed data source, this
may mean that all processing only happens on one member.
Jet 4.2 introduces the .rebalance() operator, which lets Jet
re-distribute data across the cluster at any point in the pipeline. To
use it is very simple:
Pipeline p =Pipeline.create();
p.readFrom(Sources.itemStream(1_000)).withIngestionTimestamps().rebalance().map(..)
In previous versions of Jet, it was possible to read JSON files using
the file source, but it required some manual effort to set up the parsing
yourself. With 4.2, we're now making use of
jackson-jr to parse JSON
files and offer a native JSON file source. The source provides support
for object mapping out of the box, so all you need to do is like below:
Pipeline p =Pipeline.create();
p.readFrom(Sources.json("/home/data/people",Person.class)).filter(person -> person.location().equals("NYC")).writeTo(Sinks.logger());
Similarly, we have added a sink that can output JSON files
in the same way. For more details, please see the documentation
page.
Support for JSON parsing
As part of JSON improvements, there is also now a built-in utility
method which you can use to parse JSON inside a pipeline:
Apache Pulsar is a popular, fault-tolerant
pub-sub messaging system which is a good fit for stream processing
systems. A connector for Apache Pulsar is now also available as a
contrib module
.
The source is fault-tolerant and can be used as below:
We've also made some improvements to the Jet command-line scripts. A
quick summary is below:
You can now use the config/jvm.options file to control the JVM
options when starting Jet without having to set environment variables.
We've added support to export JMX metrics through Prometheus. It's
enough to specify a PROMETHEUS_PORT environment variable to start
exporting metrics using Prometheus.
Rebuild the docker image using a multi-stage process for a
smaller footprint.
You can use the JET_MODULES environment variable to auto-import
modules to Jet without having to copy files, which is especially
useful in a docker environment.
Documentation Improvements
As part of the release, we've also made improvements and added new
sections to the documentation: